
Tennis Tips UK · Research & reports
Which tennis betting odds range was most profitable? Our 478-bet analysis
Published October 26, 2026
By The Team @ Tennis Tips UK · 26 October 2026
Which tennis betting odds range has been most profitable in our published record? We recalculated the Tennis Tips UK results, divided the bets into broad price bands, and tested how the picture changes by year, market type and the removal of exceptional winners. The headline pattern is striking. The qualifications are just as important.
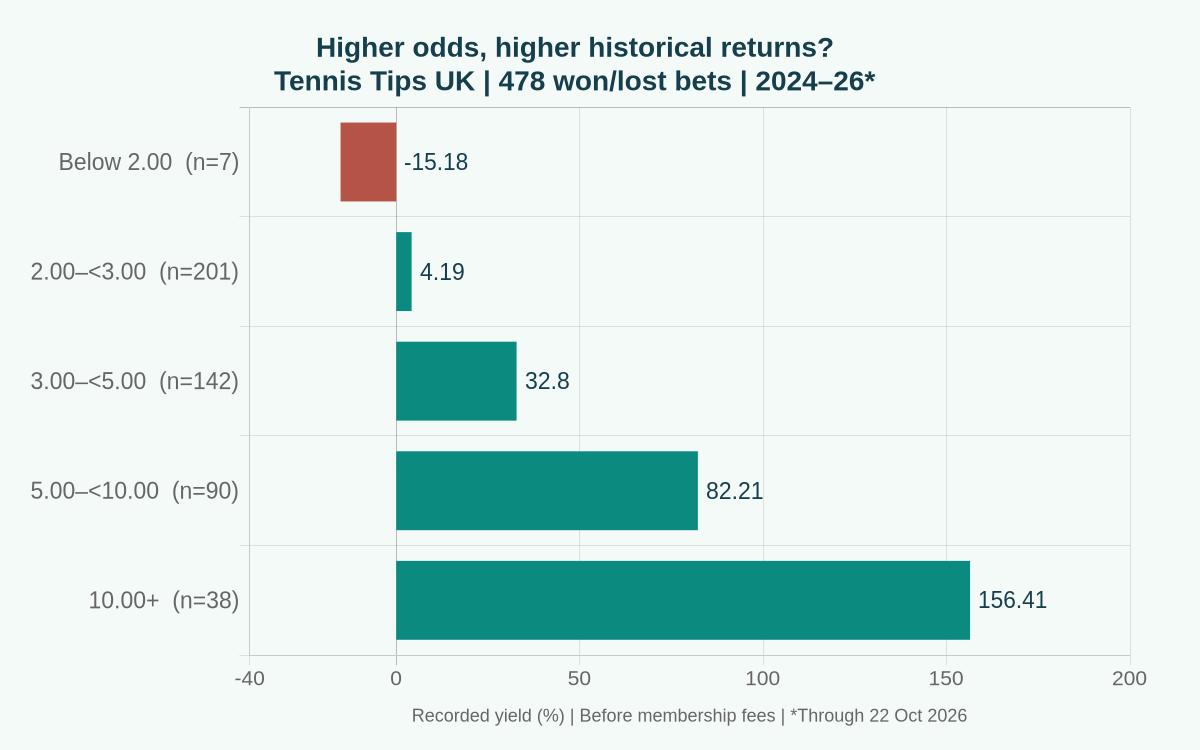
Key finding: Recorded yield rises with the odds band in the full sample, from +4.19% at 2.00–below 3.00 to +156.41% at 10.00+. But this is an exploratory analysis of selected tips, not the whole tennis market. The 5.00–below 10.00 band made +82.21% overall yet lost 34.00% in 2026 to the cut-off. The 10.00+ result rests on six winners from 38 bets and is highly sensitive to its largest payouts.
The dataset: 492 records, 478 bets with a win or loss
We extracted the public Tennis Tips UK results dashboard on 26 October 2026. It contained 492 records dated 21 January 2024 to 22 October 2026: 170 wins, 308 losses and 14 voids, with no pending bets. Every record carries a one-unit stake. Excluding the voids leaves 478 units of settled won/lost stake.
Using each record’s stored odds and outcome gives +187.3588 units, or 39.1964% yield, reproducing the dashboard’s rounded +187.36 units and +39.20%. Record IDs are unique. This reconciles the arithmetic of the published dataset; it is not an independent audit of bet placement, accepted stakes or every underlying match result.
The dashboard combines a supplied Betdiary archive with newer published records and warns that archive dates and odds can differ from original reports. We retain that source convention. Results are before membership fees; the analysis makes no additional commission or tax adjustment. It does not establish that every listed price was obtainable by every follower.
Which odds bands made money?
We used five broad, non-overlapping bands: below 2.00; 2.00 to below 3.00; 3.00 to below 5.00; 5.00 to below 10.00; and 10.00 or higher. These are transparent exploratory cut-offs, not thresholds optimised to maximise historical profit. Classification uses full stored precision rather than the dashboard’s two-decimal display.
| Odds band | Bets | W–L | Win rate | Net units | Yield |
|---|---|---|---|---|---|
| Below 2.00 | 7 | 3–4 | 42.86% | -1.06 | -15.18% |
| 2.00–<3.00 | 201 | 88–113 | 43.78% | +8.42 | +4.19% |
| 3.00–<5.00 | 142 | 50–92 | 35.21% | +46.57 | +32.80% |
| 5.00–<10.00 | 90 | 23–67 | 25.56% | +73.99 | +82.21% |
| 10.00+ | 38 | 6–32 | 15.79% | +59.44 | +156.41% |
| All won/lost bets | 478 | 170–308 | 35.56% | +187.36 | +39.20% |
The 2.00–below 3.00 band contains the most bets: 201, with 88 winners. It made +8.42 units. The 3.00–below 5.00 band made +46.57 units from 142 bets. The 5.00–below 10.00 band generated the largest absolute profit, +73.99 units, while 10.00+ had the highest percentage yield.
Winning less often was compatible with earning more in this archive because the successful higher-priced selections paid more. That does not mean lower strike rates are inherently desirable. Thirty-two of the 38 bets at 10.00+ lost. The seven sub-2.00 observations are far too few to support a useful conclusion about shorter-priced bets, and the mixed markets prevent treating them as a clean sample of match favourites.
The pattern changes when we split by year
A pooled result can hide a changing selection mix or a handful of exceptional months. We therefore repeated the same calculation within each archive year, without changing the bands. The 2026 column is an incomplete year ending 22 October; it is not a pre-registered holdout test.
| Odds band | 2024 | 2025 | 2026 to 22 October |
|---|---|---|---|
| Below 2.00 | +96.90% (2) | -60.01% (5) | No bets |
| 2.00–<3.00 | -5.97% (83) | -13.06% (58) | +34.92% (60) |
| 3.00–<5.00 | +51.16% (51) | +41.21% (49) | +0.69% (42) |
| 5.00–<10.00 | +52.50% (38) | +154.74% (38) | -34.00% (14) |
| 10.00+ | +43.21% (7) | +52.96% (24) | +624.29% (7) |
The 5.00–below 10.00 band is the clearest warning against blindly applying the overall ranking. It returned +52.50% in 2024 and +154.74% in 2025, then −34.00% from just 14 bets in 2026. Only one of those 14 bets won. That short recent period does not prove the opportunity disappeared, but it shows that the historical average did not describe every period.
The 2.00–below 3.00 band moved in the opposite direction: negative returns in both 2024 and 2025, followed by +34.92% from 60 bets in 2026. Meanwhile, 3.00–below 5.00 was positive in all three calendar slices, but its 2026 profit was only +0.29 units across 42 bets. Calling that a reliably profitable range would overstate the evidence.
How dependent are longshot profits on exceptional winners?
The 10.00+ band produced +59.435 units from 38 bets. Its biggest winner was the archive’s Juan Manuel Cerúndolo selection against Jannik Sinner at 40.39, contributing +39.39 units. That single recorded payout accounts for 66.27% of the band’s net profit and 21.02% of the complete archive’s net profit.
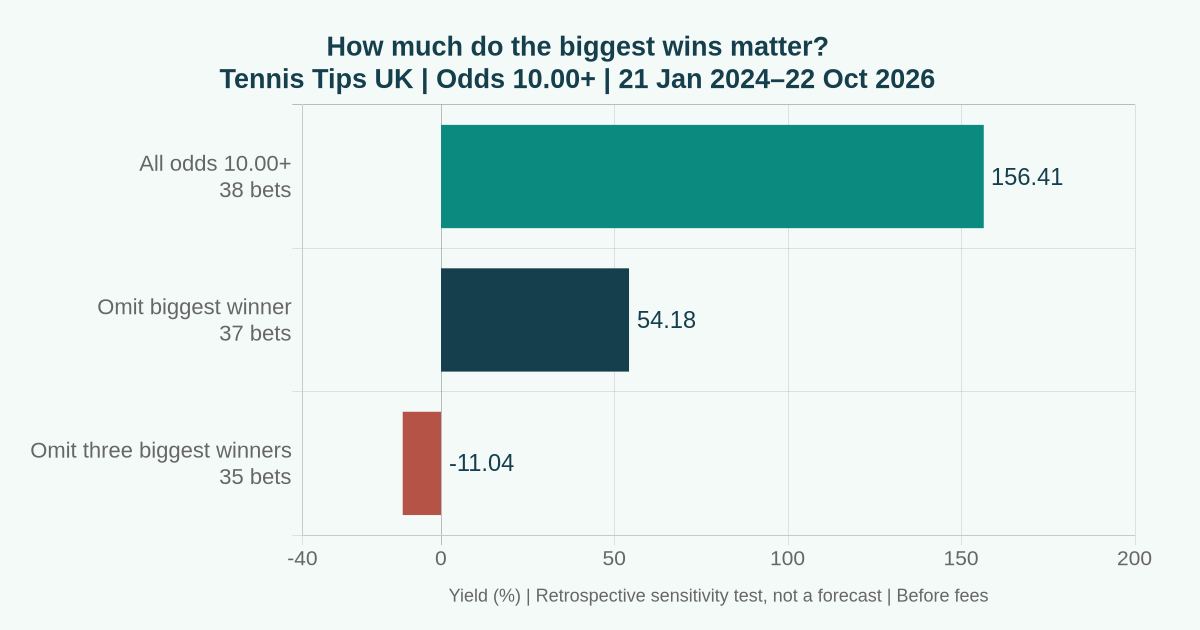
Remove only that bet and the band still shows +20.045 units on 37 bets: +54.18% yield. Remove its three largest winners—Cerúndolo at 40.39, D Goffin 2–0 at 15.00, and T Baadi −1.5 sets at 10.91—and the remaining 35 bets lose 3.865 units, a −11.04% yield.
It would be unfair to present the reduced sample as what “really” happened: longshot strategies necessarily rely on occasional large payouts. The sensitivity check instead answers a practical question about concentration. The attractive percentage is not spread evenly across many similar outcomes. If the largest winner had lost instead of being omitted, retaining all 38 stakes, the band’s yield would have been +50.12%.
A market-type check changes the comparison
The historical archive is not exclusively match-winner betting. We identified 51 won/lost selections whose labels explicitly mention a handicap, totals, over/under or set betting. That matters: a favourite backed to win 2–0 at long odds is not the same proposition as a match-winner underdog.
Removing those 51 labelled exceptions leaves 427 bets. This is a label-based sensitivity screen, not proof that every remaining row has independently verified match-winner classification. Under the same bands, the remaining sample produces:
| Odds band | Remaining bets | Recorded yield |
|---|---|---|
| Below 2.00 | 7 | −15.18% |
| 2.00–below 3.00 | 179 | +4.73% |
| 3.00–below 5.00 | 137 | +34.48% |
| 5.00–below 10.00 | 77 | +40.02% |
| 10.00+ | 27 | +164.91% |
The 5.00–below 10.00 yield falls from +82.21% to +40.02%. The broad price gradient remains, but its size depends materially on what was being backed. This is why the article concerns recorded odds bands, rather than claiming that all tennis underdogs at particular prices have a demonstrated advantage.
How does this compare with wider public evidence?
Karl Whelan’s 2025 Scottish Journal of Political Economy paper reports an analysis of 58,112 ATP and WTA matches from 2011–2022 using average closing bookmaker odds. It found that the lowest estimated-win-probability decile lost approximately 23% per unit staked, compared with about 3% for the highest-probability decile.
Those are the paper’s published aggregates, not a dataset we independently reanalysed. Its probability deciles, broad market coverage and closing prices differ from our selected tips and advised-price bands. They are useful context, not a like-for-like performance benchmark. The wider finding warns against converting our favourable longshot record into a rule to back every longshot.
A selective service can show a different historical pattern from the whole market. Establishing why requires more than this table: selection effects, price timing, market mix, execution and luck are all plausible contributors. The archive alone cannot isolate their causal roles. Our closing-line-value guide explains why comparing against the market also requires consistent timestamps and margin treatment.
Can we test injured players or first-round underdogs next?
Not reliably from the existing fields alone. The dataset has no systematic injury-status field, no consistent round field and no separate market-type column. “ATP Finals” is a tournament name, not evidence of a final-round match. Inferring a first round from an event date would also misclassify qualifiers, rescheduled matches and archive date offsets.
The largest winner illustrates the problem. Roland-Garros’ official report confirms Cerúndolo beat Sinner in the second round on 28 May 2026 and describes Sinner’s physical difficulties. The archive stores the selection under 27 May. We preserve that date for reproducibility; it does not change the odds band or calendar year.
That report corroborates the match outcome, not the advised 40.39 price or a pre-match injury signal. Information reported during or after a defeat cannot be treated as information available before betting. A defensible injury study would need dated pre-bet evidence for winners and losers, a consistent definition of injury, and a matched comparison group. It must also distinguish backing a player with a fitness concern from backing their opponent.
A first-round study is more tractable once each selection is matched to an official event, player pair, round and market. Unmatched records should remain visible and excluded transparently. Neither missing labels nor a compelling anecdote justify manufacturing a pattern.
Methods, costs and what would strengthen the finding
For every won/lost record, net profit is stake × (decimal odds − 1) for a winner and minus stake for a loser. Yield is total net profit divided by total won/lost stake. Voids contribute neither profit nor stake to these tables. The unrounded band profits, in ascending band order, are −1.0624, +8.4212, +46.5730, +73.9920 and +59.4350 units; they sum to +187.3588.
Full precision matters at boundaries: stored odds of 2.995 remain below 3.00 even if displayed as 3.00, and 1.9996 remains below 2.00. We did not round odds before grouping. The non-match-winner screen searched selection labels for “handicap”, “total”, “under”, “over” or “set betting”, case-insensitively. Annual splits use the archive date. The original results remain available through the dashboard and its CSV export.
This is exploratory, retrospective analysis with unequal samples and no untouched future test. We do not report a statistically significant edge. Dependence between selections, changing conditions and searching multiple possible explanations all limit inference. A sensible next test would freeze these bands and inclusion rules now, record future qualifying selections without cherry-picking, and report each band’s sample size and yield at a specified later review.
Membership fees, taxes, missed bets, price deterioration and any charges not already reflected in the stored odds can reduce follower returns. We have not charged an assumed commission again because the archive does not provide a uniform commission-status field. The odds calculator can illustrate price sensitivity, but it cannot turn a historical band average into a reliable forecast.
The useful pattern—and its limit
Our published record contains a real descriptive pattern: higher odds bands earned more per unit staked over this sample. It also contains strong counterweights: changing annual performance, mixed betting markets and concentrated longshot profits. Those are useful findings for monitoring the selection process. They are not a reason to increase stakes or ignore shorter-priced opportunities solely because of a historical table.
Data and sources checked: 26 October 2026. This article analyses the site’s published record as supplied and uses credited public research and an official match report for context. No bookmaker affiliate links.
18+. Betting involves risk. Past results do not guarantee future returns. Never chase losses or stake money you cannot afford to lose.
See the wider picture.
Read the research alongside the complete results record. See every win and loss and how our proprietary data model and human review select picks.
To interpret prices alongside outcomes, read our research on closing line value. It explains what a market benchmark can show and where it can mislead.
18+ · Betting involves risk · Past results cannot guarantee future profit.
Our proof standard: for each newly settled club pick, we aim to publish the original email screenshot showing the date and time sent to members, alongside a screenshot of the quoted bookmaker or exchange odds. Check the linked result report for the evidence available; older archive entries may use different formats.
Payment & membership details
Credit and debit cards are accepted through Stripe. PayPal, Apple Pay and Link are also offered where available. Stripe displays the payment options available for your device and country at checkout.
£49.99/month is the base membership price. Stripe may show a local-currency price; check the first payment and renewal amount before subscribing.
All picks and member emails are delivered in English. International members are welcome where betting is legal.
You manage your membership through Stripe and can cancel whenever you choose, without contacting us for approval. Cancellation and refunds are separate.
 Trustpilot
 TipsterCheck
Member reviews: TipsterCheck ↗ Trustpilot ↗
Maximum 10 paid members. No bookmaker affiliate links. Historical results are before fees and do not guarantee future returns.
Explore tennis betting value and profitability, units and bankroll management, or the tennis picks and results archive.
FREE TENNIS BETTING PICK
One upcoming selection. Free.
Subscribe free and confirm your email to qualify for one upcoming pre-match tennis betting pick. Our team will send it manually when the next club selection is available.
You’ll also receive published club results and an exclusive discount code by email after confirmation, if you decide to become a full paid club member. Membership is optional.
- Tournament
- Locked until sent by email
- Match
- Locked until sent by email
- Advised bet
- Locked until sent by email
Tap or click to see how to unlock your free pick.
Check your inbox to confirm. Missing the email? Check Spam, Junk or Promotions and add the sender to your contacts. One free pick per eligible new confirmed subscriber. 18+. Betting involves risk. Unsubscribe at any time.Privacy policy.