
Tennis Tips UK · Research & reports
Tennis betting research: which metrics can identify value?
Published October 13, 2026
Tennis betting research · Methodology reviewed 13 October 2026
Profitable tennis betting requires more than finding winners or backing outsiders. The price must compensate for the chance of losing, and any edge must survive uncertainty, execution and costs. A credible research programme tests those requirements instead of promising that one metric or one category of player will produce income.
This article examines the difference between prediction and value, why underdogs are not automatically bargains, and how to evaluate a claimed edge without disguising a hypothetical example as a backtest.
The mathematics of value
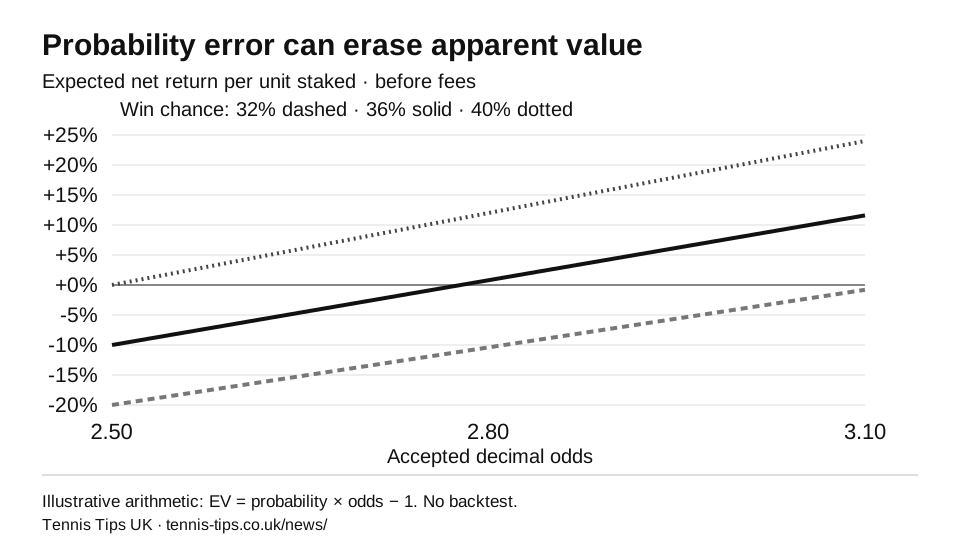
For a one-unit moneyline back bet with decimal odds O and win probability p, the expected net return before costs is p × O − 1. A win returns O − 1 net units; a loss returns −1. Break-even probability is 1/O. These identities do not estimate p: they show what must be true for the accepted odds to offer value.
At 2.80, break-even is 35.71%. If the true chance were 36%, expected return would be only +0.8% before costs. At 32%, it would be −10.4%; at 40%, +12%. A modest probability error can reverse the conclusion. Decimal odds looking generous is not enough.
Explore price and probability
Change the inputs to see the mathematics. This tool does not estimate a player’s chance or recommend a bet.One isolated back bet: effective decimal return = 1 + (odds − 1) × (1 − commission). Exchange commission may be calculated across a market; this simplified tool excludes that interaction, subscriptions and taxes.
What does the underdog evidence actually establish?
In research published on 16 January 2026, nishi of Tennis Edge reports 39,886 ATP main-draw matches for 2010–2025, using Pinnacle closing odds and one-unit stakes. The reported yields were −2.0% for backing every favourite and −5.6% for backing every underdog. The stated cleaning removed matches where the first set was incomplete and minor errors.
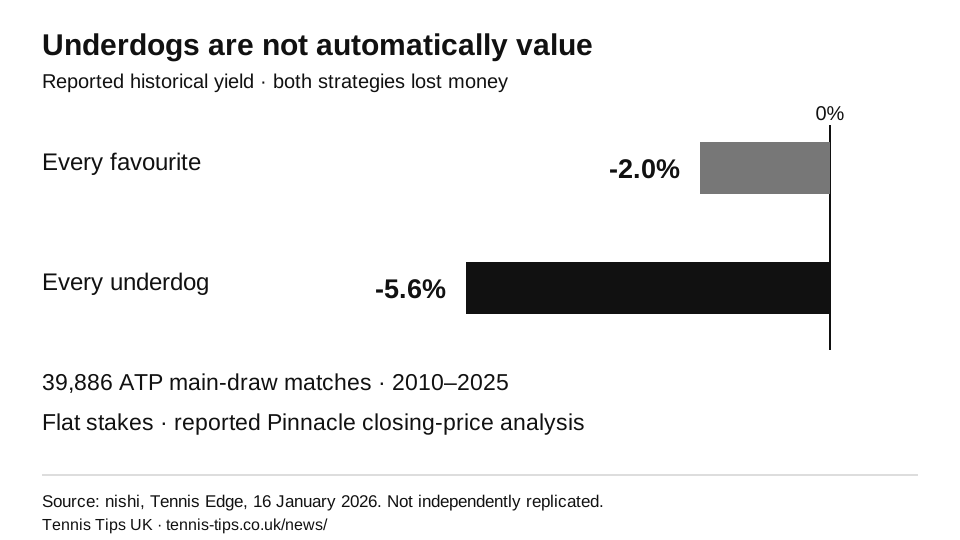
That supports caution about a blanket outsider strategy. It does not prove that no individual underdog can offer value, and it does not test our selections. Tour scope, time period, retirement handling, quote quality and staking convention all limit transfer to another record. Two negative aggregate strategies cannot identify which future prices, if any, will be profitable.
Favourite–longshot bias describes a relationship between quoted prices and outcomes; it is not a universal instruction to back favourites. A selection method has to demonstrate something beyond choosing a side of that broad split. The existing Tennis Tips UK underdog research article offers another historical perspective, with its original figures and credits retained.
Which metrics deserve research attention?
| Metric | What it can reveal | What can go wrong | Useful next test |
|---|---|---|---|
| Ranking and rating | Broad demonstrated playing strength. | Ranking points can lag current level; the market already knows the ranking. | Compare with surface-aware, time-valid ratings. |
| Serve and return | Underlying ability beyond a short win–loss run. | Opponent quality, conditions and samples distort raw rates. | Adjust for opposition and evaluate later matches. |
| Surface and court conditions | Whether a player’s strengths fit the environment. | A surface label hides speed, balls, weather and indoor differences. | Test specific contextual features, not just clay/hard/grass. |
| Head-to-head | Possible recurring style interaction. | Small samples, old meetings and double counting. | Compare a baseline with and without H2H. |
| Recent form | Possible improvement or deterioration. | Weak opponents and key-point variance create false trends. | Separate point performance from results and opposition. |
| Fitness and workload | Evidence that present capacity differs from historical strength. | Rumours, uncertain recovery and headline match lengths. | Use attributable reports and compare both players’ workloads. |
| Closing line value | Execution quality and agreement with a reference market. | Margin assumptions, liquidity and imperfect closing efficiency. | Assess calibration and net outcomes alongside CLV. |
TennisRatings’ published modelling overview highlights serve/return, opponent and surface adjustment, CLV and variance. These are useful research categories; a provider describing a metric does not establish how much it improves an independent model or whether it is underpriced today.
Many variables can help explain performance while offering little incremental betting information. A ranking gap may be striking yet entirely reflected in the quote. A long previous match may matter, but both players may have faced similar exertion. A score that ranks candidates is not necessarily a calibrated probability. Treat each hypothesis as something to test rather than something the label proves.
Account for the margin, commission and price execution
Bookmaker implied probabilities commonly sum above 100%. Taking the inverse of one quoted price does not remove that margin. Retain both outcomes and state the margin-removal convention. Exchange commission is a different cost: for an isolated winning back bet at 2.10 with 2% commission on profit, effective decimal return is 1 + 1.10 × 0.98 = 2.078.
Execution can erase an apparent edge. If a hypothetical player has a 50% win chance, odds of 2.10 imply a +5% expected return before commission. Accepting 1.95 instead changes that to −2.5%. The player and probability assumption are unchanged; the price is what changes the economics. This is illustrative arithmetic, not a forecast or recommendation.
Assess the price actually accepted or matched, including applicable commission and execution costs, rather than an unavailable headline quote. Taxes, currency conversion, deposit or withdrawal costs and local access rules may also change an individual bettor’s outcome.
A research standard for a claimed profitable angle
- Write the hypothesis first. Identify the proposed signal, competition scope, data period and decision rule. State what evidence would reject it.
- Use pre-match information only. Rankings, injuries, features and quotes must be the versions available at the decision timestamp.
- Keep an untouched later test period. Repeatedly exploring the same holdout turns it into training data. Report the original unsuccessful tests too.
- Benchmark against credible alternatives. Compare with the market and a simpler model, using the same match coverage and prices.
- Test predictions and bets separately. Calibration and log loss assess probabilities; net yield assesses the chosen execution rule. Good forecasting and profitable prices are related, not identical.
- Show all outcomes. Include losses, voids, missing quotes, sample sizes and drawdown. Break out changes in the rules instead of silently stitching versions together.
- Stress-test the claimed edge. Change accepted odds, costs, missing-data treatment and reasonable modelling assumptions. Investigate whether one season, player or extreme winner dominates it.
- Continue prospectively. Timestamp future predictions before matches and preserve revisions. A backtest is a starting point, not proof that the market will continue to offer the same opportunity.
Prediction quality versus economic usefulness
A model can correctly name many favourites and still lose money because the odds are too short. Conversely, a strategy can lose most of its bets and have a positive historical return because its winners are larger. Neither the hit rate nor a large single win establishes skill. Inspect probability calibration, the prices obtained, the full distribution of returns and costs together.
When comparing approaches, avoid assuming 1,000 bets are 1,000 independent observations. Matches share players, tournaments, conditions and seasons. Uncertainty estimates should reflect that dependence. Very selective rules can also produce unstable estimates even when the broad database looks large.
No parameter in an exploratory scoring system should be described as a validated profitability coefficient unless it has actually been validated. Screening can focus attention, human review can catch bad data, and a transparent record can support scrutiny. None makes the probability of future profit certain.
How this relates to Tennis Tips UK research
Tennis Tips UK uses a proprietary data model and an experienced human review process, refined since 2013. We explain the subjects and evidence standards without publishing the private mechanics. The supplied public club record begins in January 2024 and includes losses. It is separate from the market-wide studies discussed here.
Use the complete record to examine the club’s recorded outcomes. The research in this article concerns betting metrics and market evidence; it is not a projection of club returns or a calculation of membership affordability.
A case study in the difference between an angle and an edge
Nishi’s updated study dated 11 September 2026 reports 255 same-tournament follow-up matches after wins over specified leading players. At flat stakes and Pinnacle closing prices, backing the upset winner returned −19.3%, while backing the next opponent returned +5.3%. The author explicitly stops short of establishing the latter as a reliable profitable strategy.
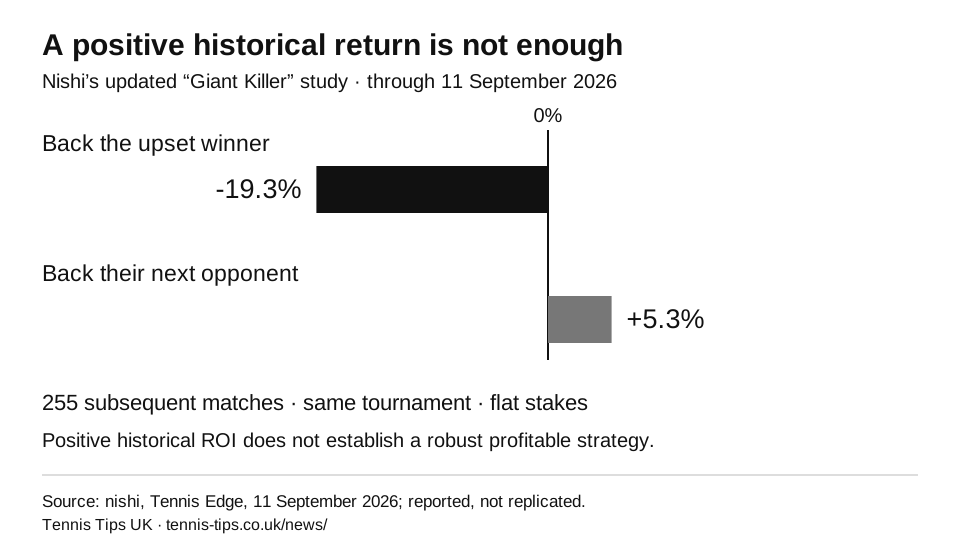
The source also notes that much of the positive opposite-side performance was concentrated in an earlier period. This raises a stability question: a historical average can look attractive while the useful effect has weakened or changed. A future test needs a frozen event definition and a later, untouched sample.
Neither side of the same-match comparison is independent evidence. The two strategies share the same matches and prices, and their returns are related through settlement and margin. A result that argues against blindly backing one subset is not automatically strong enough to justify backing the opposite subset.
What a rigorous data table should disclose
| Item | Reason | Common failure |
|---|---|---|
| Research question and eligibility rule | Defines what was tested. | Changing the rule after seeing successful examples. |
| Dates and competition scope | Shows the environment and size of the evidence. | Applying ATP results to unrelated competition levels. |
| All bets, stakes, odds and outcomes | Allows net returns to be reconstructed. | Showing a selected winner or a profitable period alone. |
| Accepted quote timing | Tests whether a real bettor could have used the price. | Using a best historical quote without availability evidence. |
| Uncertainty and concentration | Shows how much depends on sampling or a few bets. | Reporting yield without a distribution or dependence check. |
| Training and later test split | Separates discovery from evaluation. | Calling a repeatedly mined dataset an untouched test. |
| Alternative explanations | Tests whether the metric adds unique information. | Attributing an effect to fatigue without separating player strength or price. |
Use Tennis Tips UK’s record as a record, not a market experiment
The club’s public results are a selected portfolio of bets rather than a random or exhaustive sample of all tennis matches. They answer questions about those recorded selections and their historical returns. They do not by themselves prove that a ranking gap, an H2H pattern or any other individual factor caused the outcomes.
To isolate a metric’s contribution, a separate study would compare matched predictions from a baseline and an augmented model, using the same candidate universe, time-valid information and quotes. It would include rejected candidates and losses rather than only successful selections. An individual report’s proof supports the documented bet; it cannot validate every component of a private selection process.
The existing Tennis Tips UK underdog article retains historical research figures and their original credits. Read those figures alongside this market-wide evidence, while keeping the different samples, dates and methodologies separate. We do not combine them into a fabricated new backtest.
Additional source
nishi, The Giant Killer Effect, updated 11 September 2026. It is a hypothesis-generating published study, not an independently reproduced or endorsed betting system.
A structured assessment of the main tennis betting metrics
The following review treats each metric as a candidate source of information, not a ready-made betting rule. “Relevant” means it can help formulate or test a probability assessment. “Adds an edge” requires the stronger finding that the information improves decisions at prices a bettor can actually obtain. Evidence for the first claim is insufficient to establish the second.
Our review separates six issues: measurement quality, plausible mechanism, overlap with other information, the benchmark used, later-sample performance and practical execution. This framework is public. The exact Tennis Tips UK screening formula and decision rules remain private.
1. Rankings and strength ratings
Potential benefits. Rankings provide a widely available summary of demonstrated tournament performance. Ratings such as Elo offer another way to track relative strength, and surface-aware variants can distinguish players whose overall standing hides a more specialised profile. They create a useful baseline against which a richer claim can be assessed.
Weaknesses and limitations. A rank is an ordinal position, not a direct probability. The difference between two ranking positions is not automatically the same playing-strength difference at every part of the list. Participation, injury absence, tournament selection and the opposition faced can change the relationship between ranking and present ability. A career-high ranking is not evidence that a player currently performs at that level.
The edge question. A discrepancy between ranking and odds can be a research prompt, but it does not prove the market is wrong. The price may reflect information the ranking omits. Test whether a ranking or rating feature improves a named market-aware baseline in later matches, rather than celebrating cases where a lower-ranked player won. Retain the unsuccessful cases and control for surface and competition level.
2. Serve and return performance
Potential benefits. Serve-points-won and return-points-won rates offer a view beneath the match outcome. A player can lose a close match while competing well on these measures. Separating first and second serve performance can reveal which part of the game contributes to a change in results.
Weaknesses and limitations. Raw percentages depend on opponents, surface, weather and match circumstances. Strong serving figures against weak returners cannot simply be transferred to an elite returner. Small samples and changes in opponent mix can mimic improvement. First-serve percentage, first-serve points won and hold percentage measure different things; the denominators should be reported rather than treated as equivalent.
The edge question. Construct rolling, time-valid estimates and investigate opponent and condition adjustment. Compare a simple strength model with a version containing the serve/return information. Any benefit must be assessed before the match and against available odds. Post-match serve statistics can explain a result but cannot be used as if they were pre-match inputs.
3. Surface, court speed and playing conditions
Potential benefits. Surface context can help explain why the same matchup differs between events. Bounce, speed, altitude, wind and day/night conditions can alter the demands on movement, serving and rally tolerance. A general “hard-court” label is less informative than a well-supported description of the specific conditions.
Weaknesses and limitations. Conditions are often measured indirectly. A venue’s high ace rate may reflect the players drawn there, not just the court. Small grass-court samples create particular uncertainty. A historical surface profile can become stale after a change in balls, court preparation or the player’s game.
The edge question. Separate a documented condition from a subjective impression. Test whether the feature explains later performance after controlling for player mix and price. Do not impose a universal adjustment because a court is described as quick or slow. A meaningful mechanism still needs a defensible effect size and a market-aware comparison.
4. Recent form and win–loss streaks
Potential benefits. Recent performance can reveal a developing player, a recovered player or a sustained deterioration that an older summary obscures. It is valuable context when several independent measures move together and the quality of the opposition is understood.
Weaknesses and limitations. A streak compresses opponent strength, close-match variance and tournament conditions into one count. Ten wins against weak opposition are not the same evidence as ten wins against a strong field. Choosing whichever recent window supports a preferred bet is a form of retrospective selection.
The edge question. Define the lookback before evaluation, compare results with underlying point performance, and check whether the market has already repriced the player. An improving athlete is not necessarily an underpriced athlete. The later-sample test should ask whether the form feature improves probabilities or execution decisions beyond those existing inputs.
5. Break points, tie-breaks and “clutch” performance
Potential benefits. Key-point performance can focus an investigation on shot selection, serving under pressure or return positioning. Comparing it with ordinary serve and return performance can identify an apparent overperformance that deserves scrutiny.
Weaknesses and limitations. A few important points can dominate a short period. Strong break-point conversion may partly reflect the quality of the opponent’s second serve. A statistic labelled “mental strength” can combine skill, opponent effects and noise. It is particularly risky to extrapolate a brief run into a permanent trait.
The edge question. Compare pressure-point outcomes with an explicit baseline expectation and test persistence in a later period. Dan Weston’s Pinnacle article from 1 September 2017 investigates break-point overperformance and subsequent mean reversion. That is a dated research example, not proof that the same thresholds or player effects remain profitable today.
6. Head-to-head and tactical matchups
Potential benefits. Direct meetings can suggest a repeatable interaction that a broad rating misses: a return pattern, a difficult ball trajectory or a specific movement demand. A comparable set of meetings with a plausible mechanism is more informative than a bare record.
Weaknesses and limitations. Most pairings offer little data. Different surfaces, career stages or fitness conditions can make old meetings incomparable. A model based on past match results may already contain much of the same evidence, so adding H2H can double count it.
The edge question. Ask whether matchup information adds to the baseline and whether the odds already price it. The detailed H2H review shows small-sample uncertainty and compares richer interaction modelling with a market benchmark. There is no universal rule that H2H is either worthless or sufficient to identify value.
7. Injury, illness and fitness information
Potential benefits. Credible current information can explain why historical ratings no longer represent present capacity. A reliably attributed player statement, withdrawal or report is more informative than inferring fitness solely from reputation.
Weaknesses and limitations. Reports can be incomplete, ambiguous or stale. A medical timeout does not identify a diagnosis, and finishing a match does not establish full fitness. Public news may already have moved the odds. An anonymous rumour is not equivalent to a first-hand attributable report.
The edge question. Record what was known at the decision time, its source and uncertainty. Avoid manufacturing a precise probability adjustment from a vague description. Betting settlement matters as well: contracts with different retirement rules can have different economic outcomes. This is an evidence-review issue, not a medical diagnosis or a licence to assume recovery.
8. Fatigue, travel and recovery
Potential benefits. Recent court time, recovery intervals and travel can provide context absent from an aggregate rating. Comparing both players can reveal a genuine asymmetry that a headline about one long match overlooks.
Weaknesses and limitations. Match duration is an imperfect proxy for exertion. Conditions, rally intensity, rest, player characteristics and accumulated workload differ. Approximate start times should not be converted into invented exact recovery intervals. A tired appearance does not establish the size of an effect on the next match.
The edge question. Use verifiable timings and attributable reports, compare both athletes, and control for strength and odds. The hypothesis should survive more than memorable examples of a player losing after a marathon. A generic “long match means fade” rule needs prospective validation; it is not a conclusion established by this review.
9. Home conditions and career attainment
Potential benefits. Familiar conditions, travel differences and an established performance history may explain a player’s apparent strength. Career achievements can provide context when a current ranking is affected by absence or limited participation.
Weaknesses and limitations. Nationality is a crude proxy for comfort at an event. A home player may face extra pressure, unfamiliar conditions or the same travel burden as an opponent. A past title or famous name can be overvalued after current ability has declined. These variables overlap with ranking, surface and present form.
The edge question. Test concrete mechanisms rather than assuming a national or reputation-based advantage. A feature can explain why the market offers a close price without identifying a misprice. Avoid adding several bonuses for the same underlying story.
10. Odds, margin, movement and CLV
Potential benefits. Odds make the economic question explicit. Two-sided quotes allow margin to be examined; actual fills show execution; later market prices provide an external comparison. They prevent a predicted winner from being mistaken for an attractive bet at any price.
Weaknesses and limitations. A reference market is not perfectly informed in every match. Stale quotes, different settlement contracts and inadequate liquidity undermine comparisons. Margin-removal assumptions matter, particularly at long prices. Your own action or the circulation of a selection can also affect movement.
The edge question. Evaluate accepted prices, a named benchmark and settled returns together. The CLV review separates raw movement from a fair-close benchmark and explains how to audit calibration. Neither a high proprietary screening score nor a shortening price establishes positive expected value by itself.
Questions the evidence can help answer
Is H2H a relevant tennis betting metric?
Potentially, when it adds comparable tactical information. A small or stale scoreline is weak evidence, and even an informative history may already be reflected in the odds. Test incremental predictive and economic value rather than imposing an automatic rule.
Does positive CLV mean a bet was profitable?
No. It measures a price comparison under a specified definition. A positively benchmarked bet can lose, and a poorly benchmarked bet can win. A sufficiently large prospective record should examine CLV, calibration and actual net betting outcomes together.
Does a large ranking gap reveal value?
Not on its own. Ranking positions are not probabilities. Surface, participation and present capacity can explain the price. A discrepancy identifies a question to investigate; it is not proof of a bookmaker error.
Are serve and return data better than win–loss records?
They often provide more detail about how a player performed, but raw percentages also need context and adjustment. The relevant comparison is later predictive performance and value at available prices, not how sophisticated a statistic sounds.
Should I automatically oppose a player after a long match?
No automatic strategy is established here. Compare both players’ exertion, recovery and conditions. A long match is not a universal measure of fatigue, and a fatigue effect may already be priced.
Can a profitable backtest prove a lasting edge?
A backtest can support further investigation, but selection bias, price availability, changes in the market and sampling uncertainty can weaken it. Use a frozen later test and continue collecting timestamped prospective evidence.
How many matches are enough?
There is no universal number. Required evidence depends on effect size, odds, dependence, missing data and the number of hypotheses explored. A modest proposed edge generally needs more evidence than a very large effect, and match count alone cannot resolve bad study design.
Why can a useful predictor fail to produce value bets?
The odds may already incorporate its information. Improving a weak model does not necessarily beat a strong market. Execution and betting costs can also consume an improvement that is visible in forecasting scores.
Can multiple metrics be combined?
Yes, but their information may overlap. Test an appropriate combined model and remove features one at a time to examine incremental contribution. Do not stack independent-looking adjustments when they describe the same strength, surface or fitness signal.
Can I reuse these research graphics?
The download and embed controls accompany each original Tennis Tips UK graphic. Retain the source note, dataset scope, limitation and linked attribution. A graphic based on published aggregates must continue crediting the original research author too.
Sources, data and reuse
- nishi, 16 January 2026: The Favorite–Longshot Bias in Tennis: Evidence from 40,000 Matches. Its reported aggregates are attributed and have not been independently replicated here.
- Nishikori Picks, the source profile associated with the Tennis Edge research cited above.
- TennisRatings: Statistics & Modelling, for research themes rather than third-party service recommendations.
- Buchdahl’s 2019 Pinnacle market-efficiency analysis, discussed in our CLV article.
Reviewed 13 October 2026. Downloadable CSVs distinguish published aggregates from illustrative mathematics. Reuse our original graphics with the accompanying source, scope and linked attribution; do not present them as an independent replication or guaranteed strategy.
See the wider picture.
Read the research alongside the complete results record. See every win and loss and how our proprietary data model and human review select picks.
To interpret prices alongside outcomes, read our research on closing line value. It explains what a market benchmark can show and where it can mislead.
Payment & membership details
Credit and debit cards are accepted through Stripe. PayPal, Apple Pay and Link are also offered where available. Stripe displays the payment options available for your device and country at checkout.
£49.99/month is the base membership price. Stripe may show a local-currency price; check the first payment and renewal amount before subscribing.
All picks and member emails are delivered in English. International members are welcome where betting is legal.
You manage your membership through Stripe and can cancel whenever you choose, without contacting us for approval. Cancellation and refunds are separate.
Member reviews: TipsterCheck ↗ Trustpilot ↗
Maximum 50 paid members. No bookmaker affiliate links. Historical results are before fees and do not guarantee future returns.
Explore tennis betting value and profitability, units and bankroll management, or the tennis picks and results archive.
Follow the record first
Free public result updates.
Follow new public bet reports by email, with their recorded results and occasional membership invitations. Paid pre-match picks are a separate service.
Confirmation required. Unsubscribe at any time. Privacy policy.