
Tennis Tips UK · Research & reports
Does head-to-head matter in tennis betting? Evidence, context and small samples
Published October 13, 2026
Tennis betting research · Methodology reviewed 13 October 2026
A head-to-head record tells you what happened when two players met. It can suggest a repeatable matchup problem, but the scoreline alone does not tell you today’s win probability or whether the available odds are good value.
The useful question is not simply “who leads the H2H?” It is: does this history add information beyond player strength, surface, conditions, fitness and the market price?
The strongest case for H2H
Tennis is a direct interaction between styles. A returner may repeatedly exploit a particular second serve; a left-handed pattern can test the same backhand; a player’s defensive positioning can make an opponent’s usual attacking patterns less effective. Several comparable meetings, supported by point-level or tactical evidence, can suggest a mechanism that a broad rating does not fully capture.
H2H is especially useful as a research prompt. It can tell an analyst where to inspect serve placement, return position, rally tolerance and movement demands. A pattern supported by a plausible tennis explanation deserves more attention than a bare “3–0” headline.
That does not mean the mechanism is large enough to change a betting decision. An opponent may already be stronger overall, the meetings may favour their best surface, or the bookmaker may already have priced the pattern. A descriptive fact and a profitable signal are different claims.
Why three meetings are not three hundred
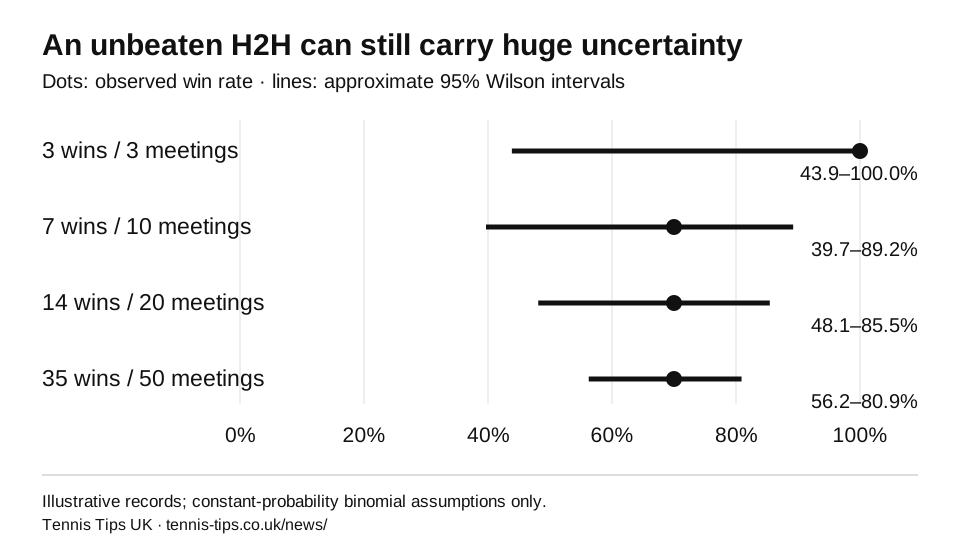
A 3–0 record feels decisive. Even under the simplifying assumption that each match has the same underlying probability and outcomes are independent, the estimate is highly uncertain. An approximate 95% Wilson interval for three wins from three matches runs from 43.9% to 100%. This is not a forecast for the next match. It demonstrates how little a tiny sample pins down a stable probability.
| Record | Observed win rate | Interval |
|---|---|---|
| 3 wins from 3 | 100% | 43.9–100.0% |
| 7 wins from 10 | 70% | 39.7–89.2% |
| 14 wins from 20 | 70% | 48.1–85.5% |
| 35 wins from 50 | 70% | 56.2–80.9% |
The NIST statistical handbook describes this interval method. Repeated-sample coverage is the interpretation: it is not a statement that there is a 95% probability that the next match’s win chance lies in this particular interval. Moreover, a tennis H2H is rarely a random sample of otherwise identical contests. The calculation understates the complexity of the real inference.
Six context checks before giving H2H weight
| Check | Potential value | Limitation |
|---|---|---|
| Surface and conditions | Comparable bounce and speed may preserve a style interaction. | Clay history can transfer poorly to grass; indoor and outdoor hard courts differ. |
| Recency and development | Recent meetings may reflect present technique and movement. | Older meetings can describe a different stage of both careers. |
| Fitness and completion | Reports can explain an unusual result. | A retirement or constrained performance is not a normal full-match observation. |
| Underlying performance | Serve and return patterns can support a mechanism. | One tie-break or a few break points can dominate the final score. |
| Expected strength | Compare outcomes with what ratings or prices already expected. | A strong player leading a weaker player 3–0 may add little new information. |
| Competition scope | A consistent dataset can be audited. | ATP main draw, qualifiers and Challenger meetings are not interchangeable coverage. |
A missing H2H is also different from a verified first meeting. If two databases disagree, investigate competition scope, naming and match status. Do not merge them into a convenient record without documenting which meetings are included.
Start from expected strength, then ask what remains
Imagine a player who was a strong favourite in each of three previous meetings. Winning all three is less surprising than if each match was priced evenly. In a deliberately simplified example, three independent matches at a 75% win chance produce three wins with probability 0.75³ = 42.2%. At 50% per match, the probability is 12.5%. The same 3–0 score can therefore carry different information.
Today’s odds still have to be considered. If a context-aware estimate were 65%, the mathematical break-even price would be 1/0.65 = 1.538 before costs. Decimal odds 1.40 would have expected return 0.65 × 1.40 − 1 = −9%, while 1.70 would imply +10.5%. These are illustrative calculations, not recommended prices or a claim that an H2H can establish a 65% probability.
H2H can help a player prediction while adding no betting value. If everyone knows the matchup story, it may already be in the quote. The benchmark should be a probability and price available before the match, rather than a successful explanation invented afterwards.
The main failure modes
Outcome compression: a 2–0 lead hides whether both matches were close or one-sided. Inspect games, points and relevant reports, but do not treat one point-level number as a complete explanation either.
Double counting: a rating based on past results may already include these meetings. Adding an unqualified H2H bonus can count the same evidence twice.
Selection bias: memorable rivalries attract attention. Searching many pairings until a striking pattern appears creates more apparent signals than a single pre-declared test would.
Recency overreaction: “won their latest meeting” discards every earlier match and can magnify an isolated upset. Recency weighting may help, but its strength must be selected using training data and assessed in genuinely later matches.
Unstable explanations: phrases such as “mental block” can become unfalsifiable. Define what evidence would weaken the theory—a changed serving pattern, a different surface or consistently close point totals—before the next result.
How to test whether H2H adds predictive information
- Choose a baseline. Use a surface-aware player-strength model, or a named margin-adjusted market probability. Store each prediction before the match.
- Define the H2H feature in advance. Specify eligible competitions, recency, treatment of retirements and how scarce records are pulled towards the baseline. Avoid choosing the definition after seeing test results.
- Use chronological validation. Fit on an earlier period and predict later matches. Each feature must use only meetings completed before the predicted match.
- Compare the same matches. A baseline and an augmented model need identical test coverage. Report how many have no prior meeting and how many have only one or two.
- Measure probabilities. Examine calibration, log loss and Brier score. Winner accuracy alone ignores confidence and the price paid.
- Test execution separately. Apply a pre-declared betting rule to actually available prices, with costs and realistic missing-price treatment.
- Report uncertainty and failures. Use appropriate time or event blocks to account for dependence. Show results by surface and period without selecting only the favourable split.
For a prediction p and binary outcome y, Brier score is (p − y)², averaged across matches. Log loss is −[y log(p) + (1 − y) log(1 − p)]. Lower values are better, but no single metric is sufficient. A very small score improvement can be irrelevant to betting after margin and execution costs.
Stephanie Kovalchik’s 2016 comparison of tennis prediction models evaluated 11 models on 2,395 ATP singles matches from 2014 and benchmarked bookmaker predictions. It provides a useful precedent for comparing models against credible competitors; it does not validate the particular H2H feature proposed here.
Our position
H2H deserves contextual review, particularly when there is repeatable tactical evidence. It should not automatically override price, present playing level or uncertainty. Tennis Tips UK reviews matchup context as part of research, but our private decision rules are not disclosed here. This article explains an evidence standard rather than supplying a mechanical H2H betting system.
Published evidence: matchup structure versus market information
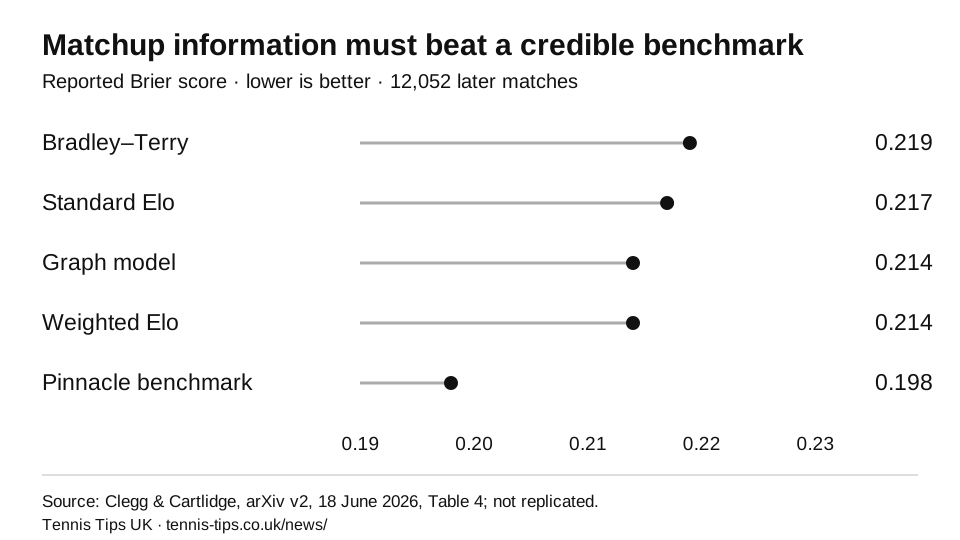
Clegg and Cartlidge’s preprint revised 18 June 2026 examines a graph representation of historical player interactions. Table 4 reports 12,052 held-out ATP/WTA matches from early 2022 to October 2025. Its graph model and Weighted Elo both have a pooled Brier score of 0.214; the margin-adjusted Pinnacle benchmark is 0.198.
| Approach | Brier score | Interpretation |
|---|---|---|
| Bradley–Terry | 0.219 | Scalar player-strength baseline. |
| Standard Elo | 0.217 | Rating baseline. |
| Graph model | 0.214 | Player-interaction representation. |
| Weighted Elo | 0.214 | Richer rating baseline. |
| Pinnacle benchmark | 0.198 | Named margin-adjusted market probabilities. |
The authors find complementary information relative to Weighted Elo, but report no measurable Brier improvement when combining the graph model with Pinnacle. The implication is important: extra information beyond a rating does not automatically mean extra information beyond the market. This is one preprint’s result, not a universal verdict on every H2H feature.
For a practical research review, retain both questions. First, does matchup information improve a specified baseline? Second, can that improvement be converted into value at prices genuinely available before the match? A comparison against a deliberately weak baseline answers only the first question.
How to read a model-performance table
A small numerical difference is not automatically a significant or economically useful improvement. The rounded equality0.214versus0.214 does not mean every individual prediction is identical. Two models can make different errors, so combining them can help even when their overall score is similar. Conversely, a combined prediction can still remain weaker than a market benchmark.
Results also need identical coverage. A grass subset may be much smaller than a hard-court subset. ATP-only evidence cannot silently be generalized to WTA or Challenger matches. Examine missing odds, retirements, quote timing, competition scope and the training/test boundary before translating a published number into a betting claim.
Additional source
Clegg, Lawrence and Cartlidge, John. Capturing Intransitive Dominance in Tennis Forecasting, arXiv 2510.20454v2, 18 June 2026. Aggregate graph results are reproduced with attribution; the underlying dataset and model have not been independently rerun here.
Sources and reproducibility
- NIST: confidence intervals for proportions, for Wilson interval mathematics.
- Kovalchik, Stephanie Ann (2016), Searching for the GOAT of tennis win prediction, Journal of Quantitative Analysis in Sports 12(3), 127–138.
- TennisRatings methodological FAQ describes contextual adjustments including head-to-head. That account is a provider’s description, not independent evidence of incremental H2H profitability.
Reviewed 13 October 2026. All numerical matchup examples are illustrative. No player-specific H2H study or proprietary Tennis Tips UK formula has been published in this article.
See the wider picture.
Read the research alongside the complete results record. See every win and loss and how our proprietary data model and human review select picks.
To interpret prices alongside outcomes, read our research on closing line value. It explains what a market benchmark can show and where it can mislead.
Payment & membership details
Credit and debit cards are accepted through Stripe. PayPal, Apple Pay and Link are also offered where available. Stripe displays the payment options available for your device and country at checkout.
£49.99/month is the base membership price. Stripe may show a local-currency price; check the first payment and renewal amount before subscribing.
All picks and member emails are delivered in English. International members are welcome where betting is legal.
You manage your membership through Stripe and can cancel whenever you choose, without contacting us for approval. Cancellation and refunds are separate.
Member reviews: TipsterCheck ↗ Trustpilot ↗
Maximum 50 paid members. No bookmaker affiliate links. Historical results are before fees and do not guarantee future returns.
Explore tennis betting value and profitability, units and bankroll management, or the tennis picks and results archive.
Follow the record first
Free public result updates.
Follow new public bet reports by email, with their recorded results and occasional membership invitations. Paid pre-match picks are a separate service.
Confirmation required. Unsubscribe at any time. Privacy policy.